The Group’s net financial debt reached €64,500 million at 31 December 2022. The €21,512 million increase from 2021 is mainly explained by the cash flow from operations, the issue and the redemption of hybrid bonds with a total impact of -€1 billion, and the capital increase of €3.15 billion.
Change in net financial debt between 31 December 2021 and 31 December 2022
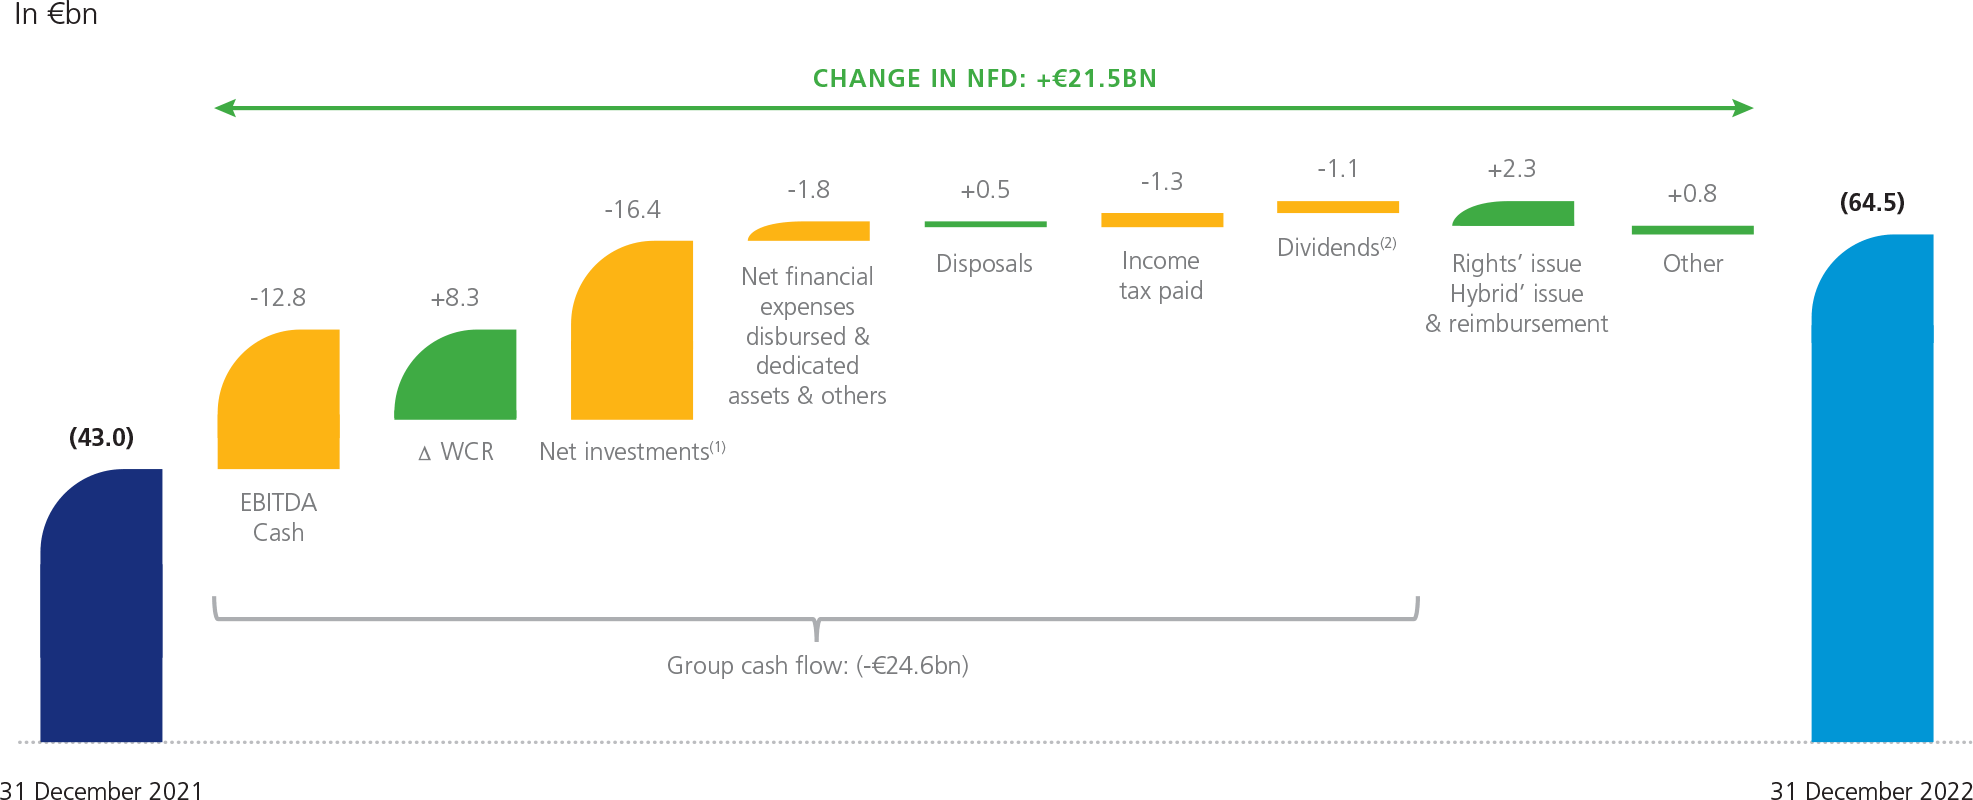
This graph shows the change in net financial debt between 31 December 2021 and 31 December 2022 in €bn.
31 december 2021: (43.0)
Group cash flow: (-€24.6bn)
EBITDA Cash: -12.8
∆WCR: +8.3
Net investments(1): -16.4
Net financial expenses disbursed & dedicated assets & others: -1.8
Disposals: +0.5
Income tax paid: -1.3
Dividends(2): -1.1
Rights’ issue Hybrid’ issue & reimbursement: +2.3
Other: +0.8
31 décembre 2022: (64.5)
Between 31 December 2021 and 31 December 2022 there is a change in NFD: +€21.5BN.
NB: figures rounded to the nearest whole number.
(1) Net investments excluding Group disposals.
(2) Dividends paid including hybrid bond remuneration.
5.1.4.2 Operating cash flow
The operating cash flow (1) was -€21,535 million in 2022, down by €21,322 million compared to 2021.
5.1.4.2.1 Cash EBITDA
EBITDA after adjustment for non-cash items amounted to -€12,811 million, down by €29,947 million from 2021, principally due to:
- the lower nuclear and hydropower output and the impacts of regulatory measures;
- a decrease in EDF Trading’s cash EBITDA given the high price volatility in 2021 and 2022. The change in working capital partly compensated for this.
5.1.4.2.2 Change in working capital
Working capital improved by €8.3 billion in 2022. This favourable change in working capital is mainly explained by the optimisation/trading activity and the CSPE mechanism.
5.1.4.2.3 Net investments
Net investments (excluding disposals and including HPC and Linky) amounted to €16,395 million in 2022, up by €670 million from 2021.
| (in millions of euros) | 2022 | 2021 | Variation | Variation (%) |
|---|---|---|---|---|
| France – Generation and supply | France – Generation and supply 2022 5,688 |
France – Generation and supply 20215,338 |
France – Generation and supply Variation350 |
France – Generation and supply Variation (%)7 |
| France – Regulated activities | France – Regulated activities 2022 4,564 |
France – Regulated activities 20214,617 |
France – Regulated activities Variation-53 |
France – Regulated activities Variation (%)-1 |
| EDF Renewables | EDF Renewables 2022 1,619 |
EDF Renewables 2021853 |
EDF Renewables Variation766 |
EDF Renewables Variation (%)90 |
| Dalkia | Dalkia 2022 324 |
Dalkia 2021284 |
Dalkia Variation40 |
Dalkia Variation (%)14 |
| Framatome | Framatome 2022 294 |
Framatome 2021381 |
Framatome Variation-87 |
Framatome Variation (%)-23 |
| United Kingdom | United Kingdom 2022 2,978 |
United Kingdom 20213,054 |
United Kingdom Variation-76 |
United Kingdom Variation (%)-2 |
| Italy | Italy 2022 701 |
Italy 2021909 |
Italy Variation-209 |
Italy Variation (%)-23 |
| Other international | Other international 2022 167 |
Other international 2021289 |
Other international Variation-122 |
Other international Variation (%)-42 |
| Other activities | Other activities 2022 61 |
Other activities 20210 |
Other activities Variation61 |
Other activities Variation (%)n.a |
| NET INVESTMENTS | NET INVESTMENTS 2022 16,395 |
NET INVESTMENTS202115,725 | NET INVESTMENTSVariation670 | NET INVESTMENTSVariation (%)4 |
Net investments by the France – Generation and supply segment were up by €350 million, due notably to costs for addressing stress corrosion.
Net investments by the France – Regulated activities segment (including Linky) were down by €53 million, mainly reflecting the smaller volume of work as the Linky programme drew to a close, despite an increase in connection work.
At EDF Renewables, the €766 million increase reflects large-scale investments in the United States, and lower subsidies and disposals than in 2021.
(1) Operating cash flow is not an aggregate defined by IFRS as a measure of financial performance and is not directly comparable with indicators of the same name reported by other companies. This indicator, also known as Funds From Operations (“FFO”), is equivalent to net cash flow from operating activities, changes in working capital after adjustment where relevant for the impact of non-recurring effects, net investments (excluding disposals in 2021-2022), and other items, including dividends received from associates and joint ventures.