1. The group, its strategy and activities
1.1 Key figures and business modelEDF Carbon trajectory
Carbon intensity trajectory
(In gCO2/kWh)
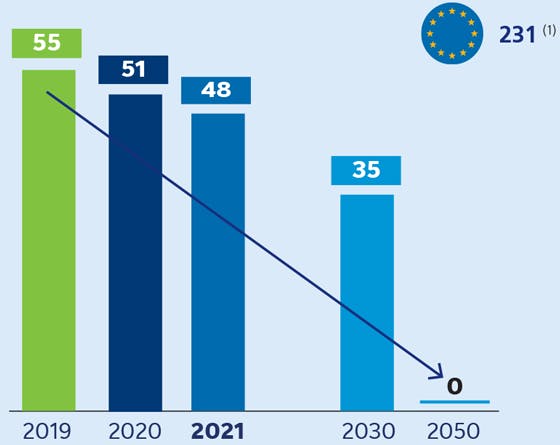
Steadily declining and around 5x lower than the European average
231(1)
- 2019: 55
- 2020: 51
- 2021: 48
- 2030: 35
- 2050: 0
(1) 2020 carbon intensity average of power producers in Europe accoding to the European Environment Agency (EEA).
EDF, the renewable energy leader in Europe
Net installed renewable capacity by sector - 2021
In GW
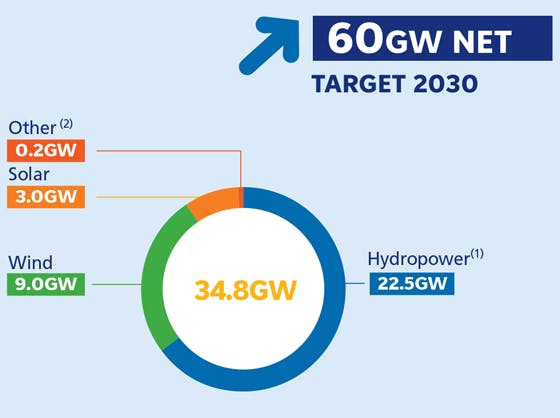
60 GW NETS TARGET 2030
34.8GW
- Other(2) 0.2GW
- Solar 3.0GW
- Wind 9.0GW
- Hydropower(1) 22.5GW
(1) Including sea energy.
(2) Biomass, geothermy.
Key figures 2021*
Installed capacity(1)
In GW

Total: 117.3GW
- Other EnR 8%
- Hydropower 18%
- Nuclear 60%
- Gas 9%
- Coal 2%
- Fuel Oil 3%
(1) Consolidated data.
Electricity generation(1)
In TWh

523,7TWh
- Nuclear 78.2%
- Hydropower(2) 8.8%
- Other EnR 4.0%
- Gas 7.3%
- Fuel Oil 1.0%
- Coal 0.7%
- Decarbonised(3) 91%
(1) Consolidated data.
(2) Hydro output including pumped storage consumption.
(3) Direct output-related CO2 emissions, excluding life-cycle analysis (LCA) of fuel and production means.
* The Group’s financial outlook is presented in Section 5.5.